Tucson Monsoon Season Data & Home Flood-Risk Reference
A sourced, homeowner-facing reference on how the North American Monsoon affects Tucson and Pima County: official season dates, historical flood events, which washes flood, haboob/dust-storm frequency, the mold-after-water-intrusion timeline, and risk factors by home type and age. Every figure below is drawn from a public source — National Weather Service (NWS) Tucson, the Pima County Regional Flood Control District, FEMA, NOAA, and the University of Arizona — and linked at the point of use so it can be checked and cited.
Looking for the headline stats and a ready-to-cite report? See the Tucson Monsoon Water-Damage Report 2026 for the five most-quoted findings from this dataset plus a copy-paste citation and embed kit.
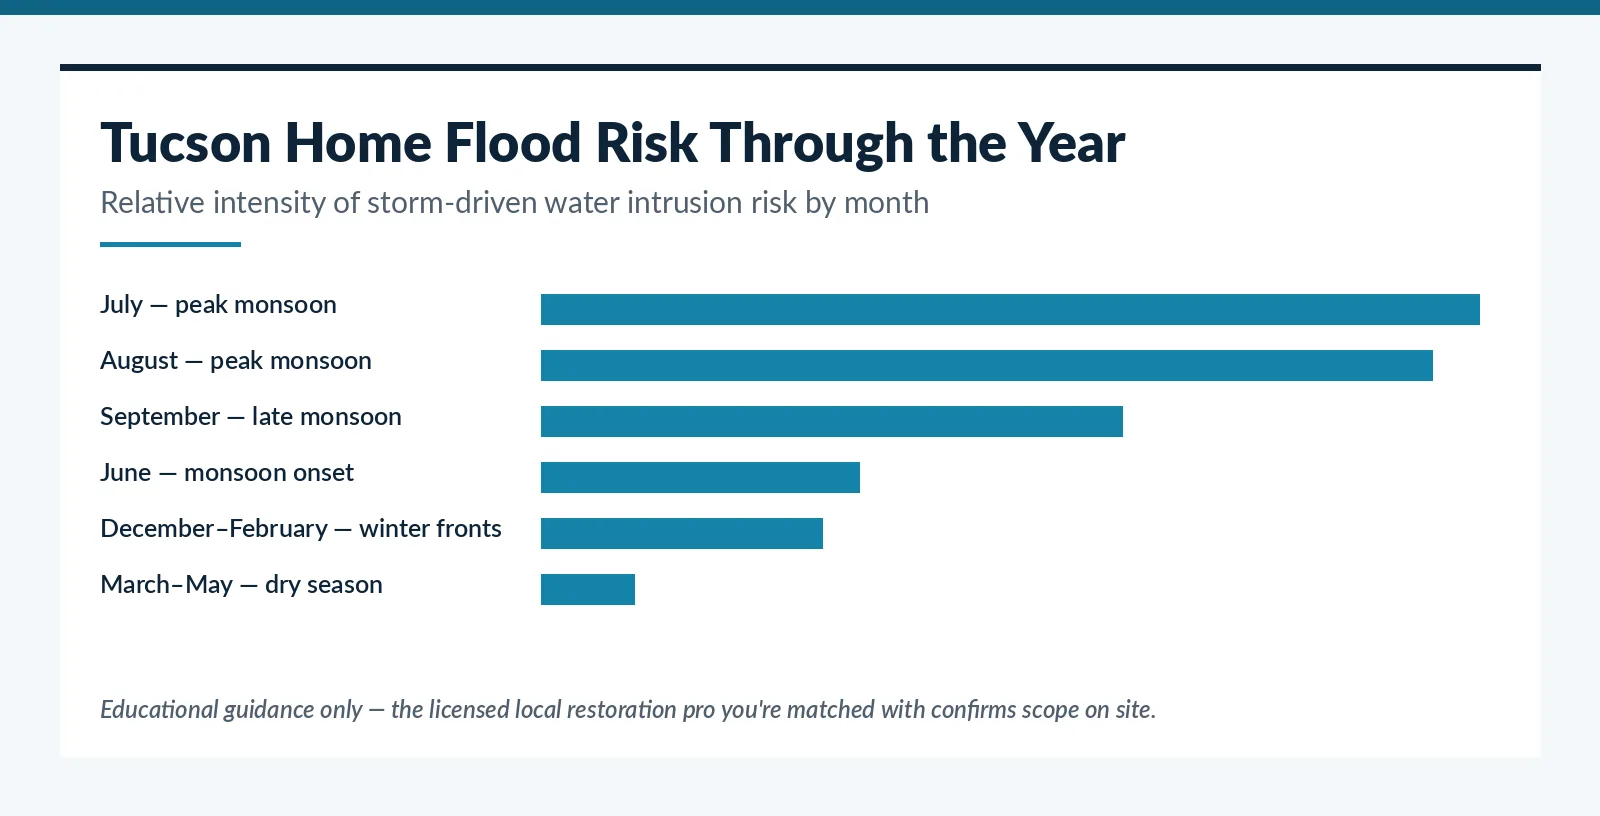
See this month’s risk at a glance:
The Numbers: Quotable Stats for Reporters & Editors
Pulled directly from the sourced data on this page — each figure links to its original public source below and can be quoted or screenshotted with attribution.
Monsoon Season at a Glance
| Measure | Value | Source |
|---|---|---|
| Official monsoon season (fixed dates, adopted 2008) | June 15 – September 30 | NWS Tucson |
| Typical measurable-rain onset | Late June to early July (varies by year) | NWS Tucson |
| Peak storm-frequency window | Mid-July through mid-August | NWS Tucson |
| Wettest monsoon on record (Tucson) | 2021 – 12.80″ total, 3rd-wettest on record; most of the Tucson area topped 10″ | NWS Tucson monsoon tracking |
| How fast a dry wash can flood | As little as 45 minutes from first runoff to a dangerous flow | Pima County Regional Flood Control District |
Monsoon Rainfall by Month — Tucson International Airport
NOAA’s 30-year climate normals (1991–2020) show how concentrated Tucson’s rainfall really is: July and August alone account for roughly 40% of the city’s average annual precipitation.
Source: NOAA 1991–2020 Climate Normals, Tucson International Airport (via NWS station data). Darker bars mark the official June 15–September 30 monsoon window. See NWS Tucson monsoon tracking.
Notable Historical Flood Events in the Tucson Area
Pima County’s flood history is well documented back to the late 1800s, but the following events are the ones most consistently cited by NWS and Pima County as benchmark floods for the region.
| Year | Event | What happened | Source |
|---|---|---|---|
| 1945 | Aug. 9 flash flood | Overflowing washes on Tucson’s south side tore a 15-foot gap in the Benson Highway bridge; flooding was linked to 10 drowning deaths. | NWS Tucson flood history |
| 1977–1993 | Six presidential-declared flood disasters | Oct. 1977, Mar. 1978, Dec. 1978, Oct. 1983, Jul. 1990, and Jan. 1993 — six separate federally declared flood disasters in a 16-year span. | Pima County Regional Flood Control District |
| 1978 | District formed | The Pima County Regional Flood Control District was created in June 1978, directly in response to back-to-back flood disasters. | Pima County |
| 1983 | “Flood of record” (Oct. 1–2) | 6.5–7.5″ of rain fell across the Tucson area over five days — still the benchmark flood for the region, with damage widely described by NWS and Pima County as among the costliest floods in the region’s history. | NWS Tucson / Pima County |
| 1984 | Tropical Storm Octave remnants | A four-day rain event caused Rillito Creek bank erosion that dropped buildings into the creek, heavy agricultural damage in Marana, substantial repair and mitigation costs across the district, and four deaths. | NWS Tucson flood history |
| 2021 | 3rd-wettest monsoon on record | 12.80″ season total; most of the metro area exceeded 10″ of monsoon rainfall. | NWS Tucson monsoon tracking |
| 2026 | FEMA flood map update | FEMA issued updated flood hazard maps for Pima County, reflecting revised floodplain and wash-overflow modeling. | FEMA press release, Jan. 2026 |
This is a representative, not exhaustive, list. Full source pages: NWS Tucson – Southeast Arizona Flood History and Pima County – Historical Flood Events.
Federally Declared Flood Disasters by Decade
Pima County’s own flood-control history shows how concentrated the region’s worst flood years were — a 16-year run that led directly to the creation of the Flood Control District in 1978.
Source: Pima County – Historical Flood Events (Oct. 1977, Mar. 1978, Dec. 1978, Oct. 1983, Jul. 1990, Jan. 1993).
Which Washes and Areas Flood
Pima County’s washes are ephemeral — dry most of the year, but capable of turning into dangerous flows within roughly 45 minutes of a heavy storm cell, according to Pima County Regional Flood Control District public safety messaging. The District actively monitors vegetation growth in washes because overgrowth changes how fast a channel fills and how far water spreads outside the defined channel. Washes and drainages most frequently referenced in Pima County flood-control planning and local flood reporting include the Santa Cruz River, the Rillito Creek/Pantano Wash system, Tanque Verde Wash, and Julian Wash, along with the many unnamed washes that cut through newer subdivisions on the metro fringe (areas such as Rita Ranch, Marana, Sahuarita, and Vail sit closest to active wash systems).
Homeowner takeaway: a property doesn’t need to be inside a mapped 100-year floodplain to be affected — localized wash overflow, storm-drain backup, and sheet flow across low points cause the majority of residential water-intrusion calls during monsoon season. Check your address against the current FEMA flood hazard map (updated for Pima County in January 2026) and the Pima County floodplain management page rather than relying on assumptions about your neighborhood.
Monsoon Flood-Risk Reference by Tucson Area
This is a wash-proximity reference, not a FEMA flood-zone determination — check your exact address against the FEMA Flood Map Service Center and the Pima County floodplain maps linked above. Areas are grouped by the major named wash or drainage system Pima County’s flood-control planning associates with that part of the metro.
| Area | ZIP codes | Nearby wash / drainage system | Why exposure runs higher here |
|---|---|---|---|
| Rita Ranch & Vail | 85641, 85747 | Pantano Wash / Cienega Creek drainages | Newer fringe subdivisions sit closest to active, less-channelized desert washes. |
| Marana & Dove Mountain | 85653, 85658, 85743 | Santa Cruz River corridor | Low-lying valley-floor terrain along the Santa Cruz flagged by Pima County for sheet-flow and wash-overflow risk. |
| Catalina Foothills & Oro Valley | 85718, 85750, 85737, 85755 | Alluvial washes off the Santa Catalina Mountains | Steep mountain-front drainages concentrate runoff fast — the ~45-minute wash-to-flood window applies directly here. |
| Central & East Tucson | 85701, 85710–85716, 85719 | Arroyo Chico / Rillito Creek & Pantano Wash system | Established neighborhoods sit near the Rillito/Pantano confluence area the Flood Control District was formed to manage. |
| Casas Adobes & Flowing Wells | 85704, 85741 | Rillito Creek | Sits directly alongside a major named wash channel the District actively monitors. |
| Sahuarita & Green Valley | 85629, 85614, 85622 | Santa Cruz River (southern reach) | Downstream valley-floor location within the Santa Cruz corridor covered by regional flood-control planning. |
Areas and ZIP codes per Tucson Restoration Pros service-area listing; wash/drainage associations per Pima County Regional Flood Control District public materials. Always verify your exact address against the FEMA Flood Map Service Center.
Dust Storms & Haboobs: Tucson’s Real Exposure
Tucson is frequently lumped in with Phoenix when people talk about Arizona “haboobs,” but the geography is different. Phoenix sees an estimated 2 to 7 significant dust storms per monsoon season because outflow winds from collapsing thunderstorms have open desert to build a mile-high wall of dust. Tucson sits in a basin ringed by mountain ranges (the Santa Catalinas, Rincons, Santa Ritas, and Tucson Mountains), which breaks up and slows that outflow before it can organize into a classic haboob wall. That doesn’t mean zero risk: monsoon outflow winds still produce shorter-range blowing-dust events and localized visibility drops, and the NWS still issues dust storm warnings for the region in active monsoon years.
Source: NWS – Dust Storms and Haboobs safety page; regional haboob-frequency context from NWS/university dust-workshop research on Arizona monsoon dust events.
The Mold Timeline After Water Intrusion
How fast mold becomes a real problem after a monsoon leak, flood, or roof intrusion is one of the most consistently misunderstood parts of storm damage. The U.S. EPA’s guidance is specific about the window:
| Time since water exposure | What’s happening |
|---|---|
| 0–24 hours | Mold spores already present in the home absorb moisture and begin germinating. Nothing is visible yet — no smell, no discoloration. |
| 24–48 hours | Per EPA guidance, this is the outer edge of the safe drying window. Germinating spores transition into active colonies if materials are still wet. |
| 48–72 hours | Colonies that formed in the prior window can become visible as small dark or greenish-black spots on drywall, wood framing, or carpet backing. |
| 1–2 weeks | Untreated colonies spread across adjoining wet materials; remediation scope and cost increase substantially versus early intervention. |
Source: U.S. EPA – A Brief Guide to Mold, Moisture, and Your Home.
Homeowner Risk Factors by Home Type & Age
| Home characteristic | Why it raises flood/water risk |
|---|---|
| Slab-on-grade homes built before the mid-1980s | Older grading standards means finished floor height is often closer to surrounding grade, so sheet flow can reach the slab and door thresholds faster than in newer builds. |
| Homes adjacent to a wash or drainage easement | Even homes well outside a mapped 100-year floodplain can see overflow during high-intensity, short-duration monsoon cells. |
| Manufactured and mobile homes | Lower floor clearance and skirting design make these units more vulnerable to fast-rising sheet flow than site-built homes. |
| Homes with flat or low-slope built-up roofs | Roof drains and scuppers clog with dust and debris between storms, so the first heavy monsoon cell of the season is the highest-risk event for roof-level water intrusion. |
| Newer subdivisions on the metro fringe | Areas like Marana, Sahuarita, Rita Ranch, and Vail sit closest to active, less-channelized wash systems as development continues to expand toward them. |
Context: Pima County Floodplain Management Goals & Practices; FEMA – Updated Flood Maps for Pima County (Jan. 2026).
Frequently Asked Questions
When does monsoon season officially start and end in Tucson?
The National Weather Service has used fixed calendar dates since 2008: June 15 through September 30. Actual measurable rain typically begins somewhat later than June 15, with the heaviest storm frequency arriving mid-July through mid-August.
What was the worst flood in Tucson history?
The October 1–2, 1983 flood is generally cited as Tucson’s flood of record, with 6.5–7.5 inches of rain over five days and damage widely described by NWS and Pima County as among the costliest floods in the region’s history.
Does Tucson get haboobs like Phoenix?
Less often and less dramatically. Tucson’s surrounding mountain ranges break up the outflow winds that build Phoenix’s classic haboob walls, though localized blowing-dust events still occur during active monsoon years.
How fast does mold start growing after a leak or flood?
Per EPA guidance, mold can begin germinating within 24 hours of water exposure and often becomes visible within 48–72 hours if materials are not fully dried.
Is my home at flood risk if it’s not in a mapped floodplain?
Yes, potentially. Localized wash overflow and sheet flow cause many residential water-intrusion events even outside FEMA-mapped 100-year floodplains, particularly for slab-on-grade homes near a wash or drainage easement.
Where can I check my property’s actual flood risk?
Start with the current FEMA flood hazard maps for Pima County (updated January 2026) and the Pima County Regional Flood Control District’s public flood-hazard resources, both linked in the sources section below.
Homeowner in Pima County dealing with monsoon water intrusion?Call now on our homepage and we route you to a qualified, licensed local restoration crew. Free to request, no obligation — we are a referral service, not a contractor.
Methodology & Data Sources
This reference is compiled entirely from publicly published data — no original surveys, polling, or proprietary modeling. Figures come from National Weather Service (NWS) Tucson climate and flood-history pages, NOAA’s 1991–2020 climate normals, the Pima County Regional Flood Control District’s public safety and historical-event materials, FEMA’s flood hazard maps and press releases, and the U.S. EPA’s mold-timeline guidance. Every stat above links directly to the source page it came from. Data was compiled and cross-checked in July 2026 and is reviewed each monsoon season (June–September); if a figure looks outdated, we update it — see how we research and source our guidance.
Full source list:
- NWS Tucson – Monsoon (official season dates, precipitation and lightning tracking, monthly rainfall normals)
- NWS Tucson – Southeast Arizona Flood History
- Pima County – Historical Flood Events
- Pima County Regional Flood Control District
- Pima County – Floodplain Management Goals & Practices
- FEMA – Updated Flood Maps for Pima County (Jan. 2026)
- FEMA Flood Map Service Center
- U.S. EPA – A Brief Guide to Mold, Moisture, and Your Home
- NWS – Dust Storms and Haboobs
- University of Arizona Cooperative Extension – Climate & Monsoon Tracking
- Tucson Restoration Pros – Service Areas & ZIP Codes
Related Tucson Resources
About this reference
This page compiles publicly available data from the National Weather Service, NOAA, the Pima County Regional Flood Control District, FEMA, the U.S. EPA, and University of Arizona climate resources. It is a reference tool, not restoration advice specific to any property. Data compiled July 2026, last refreshed July 24, 2026 for the current monsoon season; source pages are linked directly above so figures can be independently verified. See how we research and source our guidance.
Disclosure: Tucson Restoration Pros (tucsonrestorationpros.com) is a lead-generation and referral service. We are not a restoration contractor, are not affiliated with any government agency, and do not perform restoration, mitigation, or repair work. When you submit your information, we connect you with one or more independent, qualified local restoration companies that handle the work, licensing, and insurance. We make no guarantee about any specific company’s results. In a life-threatening emergency, call 911.
Same-day, emergency, and 24/7 availability are not guaranteed and depend on provider schedules, location, and demand. Calls and form submissions placed through this site may be connected with a participating provider, and you may be contacted by that provider regarding your request. Service availability, pricing, licensing, and final response times are determined solely by the providers.