Data & Research Report
Tucson Monsoon Water-Damage Report 2026
Published Aug 15, 2026 · Last updated Oct 13, 2026 with final 2026 season rain-gauge totals · Reviewed and refreshed each monsoon season (June–September) · An original data synthesis built from National Weather Service, NOAA, Pima County, FEMA and U.S. EPA public records — not a survey, not a model, no proprietary data.
Quick answer
Tucson’s monsoon season runs June 15–September 30, but NOAA data shows roughly 54% of the metro’s average annual rainfall falls inside that 3.5-month window. Flash-flood risk peaks mid-July through mid-August, when a dry wash can turn dangerous in about 45 minutes (Pima County Regional Flood Control District). The window to dry out a water-damaged home before mold becomes established is the same 24–48 hours most insurers recommend for reporting a claim. Our breakdown of why water damage hits adobe and historic homes differently goes deeper on this.
2026 season: Tucson International Airport, the city’s official gauge, recorded 5.76″ from June 15 to September 30 — about normal (5.69″) and roughly double 2025’s 2.82″. Most neighborhood gauges caught more: the median across 53 complete Pima County gauges was 8.53″. See the gauge-by-gauge table.
The Headline Findings
Seven numbers from this report, each pulled from a named public source and free to quote or embed with attribution — see the cite-this-report kit below.
2026 Monsoon Rainfall: The Official Gauge vs. Neighborhood Gauges
Tucson’s official monsoon total is measured at Tucson International Airport. In 2026 that gauge recorded 5.76″ between June 15 and September 30 — about 101% of the 1991–2020 normal of 5.69″ and roughly double the 2.82″ recorded in 2025. The season started fast (1.05″ in the last half of June, versus a normal of 0.18″), stalled in July (0.70″, about 32% of normal), then caught up in August (3.21″, about 162% of normal). The airport logged 27 days with measurable rain (0.01″ or more) in the 2026 season, compared with 17 in 2025; its wettest single day was 0.84″ on August 31.
Tucson International Airport: 2026 vs. 2025 vs. normal (inches)
| Period | 2026 | 2025 | 1991–2020 normal |
|---|---|---|---|
| Jun 15–30 | 1.05 | Trace | 0.18 |
| July | 0.70 | 1.88 | 2.21 |
| August | 3.21 | 0.11 | 1.98 |
| September | 0.80 | 0.83 | 1.32 |
| Season total (Jun 15–Sep 30) | 5.76 | 2.82 | 5.69 |
Source: NOAA Regional Climate Centers – Applied Climate Information System (ACIS), “Tucson Area” threaded station record (Tucson International Airport), the same data feed behind the Monsoon Stats table on NWS Tucson’s Monsoon page. Normals are NOAA 1991–2020. Retrieved Oct 13, 2026; 2026 values are preliminary.
Season total at Tucson International Airport (inches)
Neighborhood rain gauges: 2026 vs. 2025 monsoon totals (inches)
The airport sits on Tucson’s south side, and monsoon storms are notoriously patchy. Among 53 Pima County gauges below 4,500 ft with no missing days in the 2026 season, the airport recorded the lowest total and the median gauge recorded 8.53″. All 42 of those gauges that also had a complete 2025 record measured more rain in 2026 than in 2025 (median about 8.5″ vs. about 3.9″). A representative selection, sorted by 2026 total:
| Gauge (network) | General area | 2026 | 2025 | Change |
|---|---|---|---|---|
| Valencia West 1.1 E (CoCoRaHS) | Southwest Tucson | 12.81 | 3.92 | +8.89 |
| Marana 4.9 SE (CoCoRaHS) | Marana / northwest | 10.32 | 2.40 | +7.92 |
| Catalina State Park (NWS COOP) | Oro Valley / Catalina foothills | 10.03 | 3.89 | +6.14 |
| Tucson 11 W (NWS COOP) | West of the Tucson Mountains | 9.54 | 3.63 | +5.91 |
| Tucson 10.3 WNW (CoCoRaHS) | West / northwest | 8.83 | 2.93 | +5.90 |
| Oro Valley 3.1 NNW (CoCoRaHS) | Oro Valley | 8.82 | 4.70 | +4.12 |
| Flowing Wells 6.0 NNW (CoCoRaHS) | North-northwest | 8.53 | 3.94 | +4.59 |
| Tucson 8.9 E (CoCoRaHS) | East side | 8.37 | 4.58 | +3.79 |
| Saguaro National Park (NWS COOP) | Far east side | 7.86 | 3.83 | +4.03 |
| Green Valley 1.5 NW (CoCoRaHS) | Green Valley | 7.75 | 5.26 | +2.49 |
| Tucson 5.8 ENE (CoCoRaHS) | East-central | 7.41 | 3.55 | +3.86 |
| Tucson 7.3 WNW (CoCoRaHS) | West side | 7.09 | 2.67 | +4.42 |
| Vail 7 N (NWS COOP) | Vail area | 6.88 | 4.57 | +2.31 |
| Tucson International Airport (official) | South side | 5.76 | 2.82 | +2.94 |
Source: NOAA Regional Climate Centers – ACIS multi-station query for Pima County, daily precipitation summed June 15–September 30 of each year; also browsable via xmACIS. COOP = NWS Cooperative Observer Program stations; CoCoRaHS = Community Collaborative Rain, Hail & Snow Network volunteer gauges. Shown: gauges with zero missing days in both seasons. Gauge names are the networks’ own (distance and direction from a reference point); “general area” is a plain-language description, not a neighborhood boundary. Retrieved Oct 13, 2026; preliminary and subject to quality control. Pima County’s ALERT flood-warning gauges were not used because a full-season export was not available to us.
2026 monsoon total by gauge (inches)
Bars scaled to the largest value shown (12.81″). Data: NOAA RCC ACIS, retrieved Oct 13, 2026 (preliminary).
Why it matters for homeowners: the official number can understate what fell on a given street. A home in a part of the metro that received 9–12″ this season saw roughly double the airport’s total — more saturated soil around slabs and stem walls, more load on roof drains and scuppers, and more runoff through nearby washes. If you noticed new staining, musty odors, or soft drywall after the August storms, the mold timeline below explains why it is worth checking now rather than waiting for next summer.
How Much of Tucson’s Rain Falls During Monsoon Season?
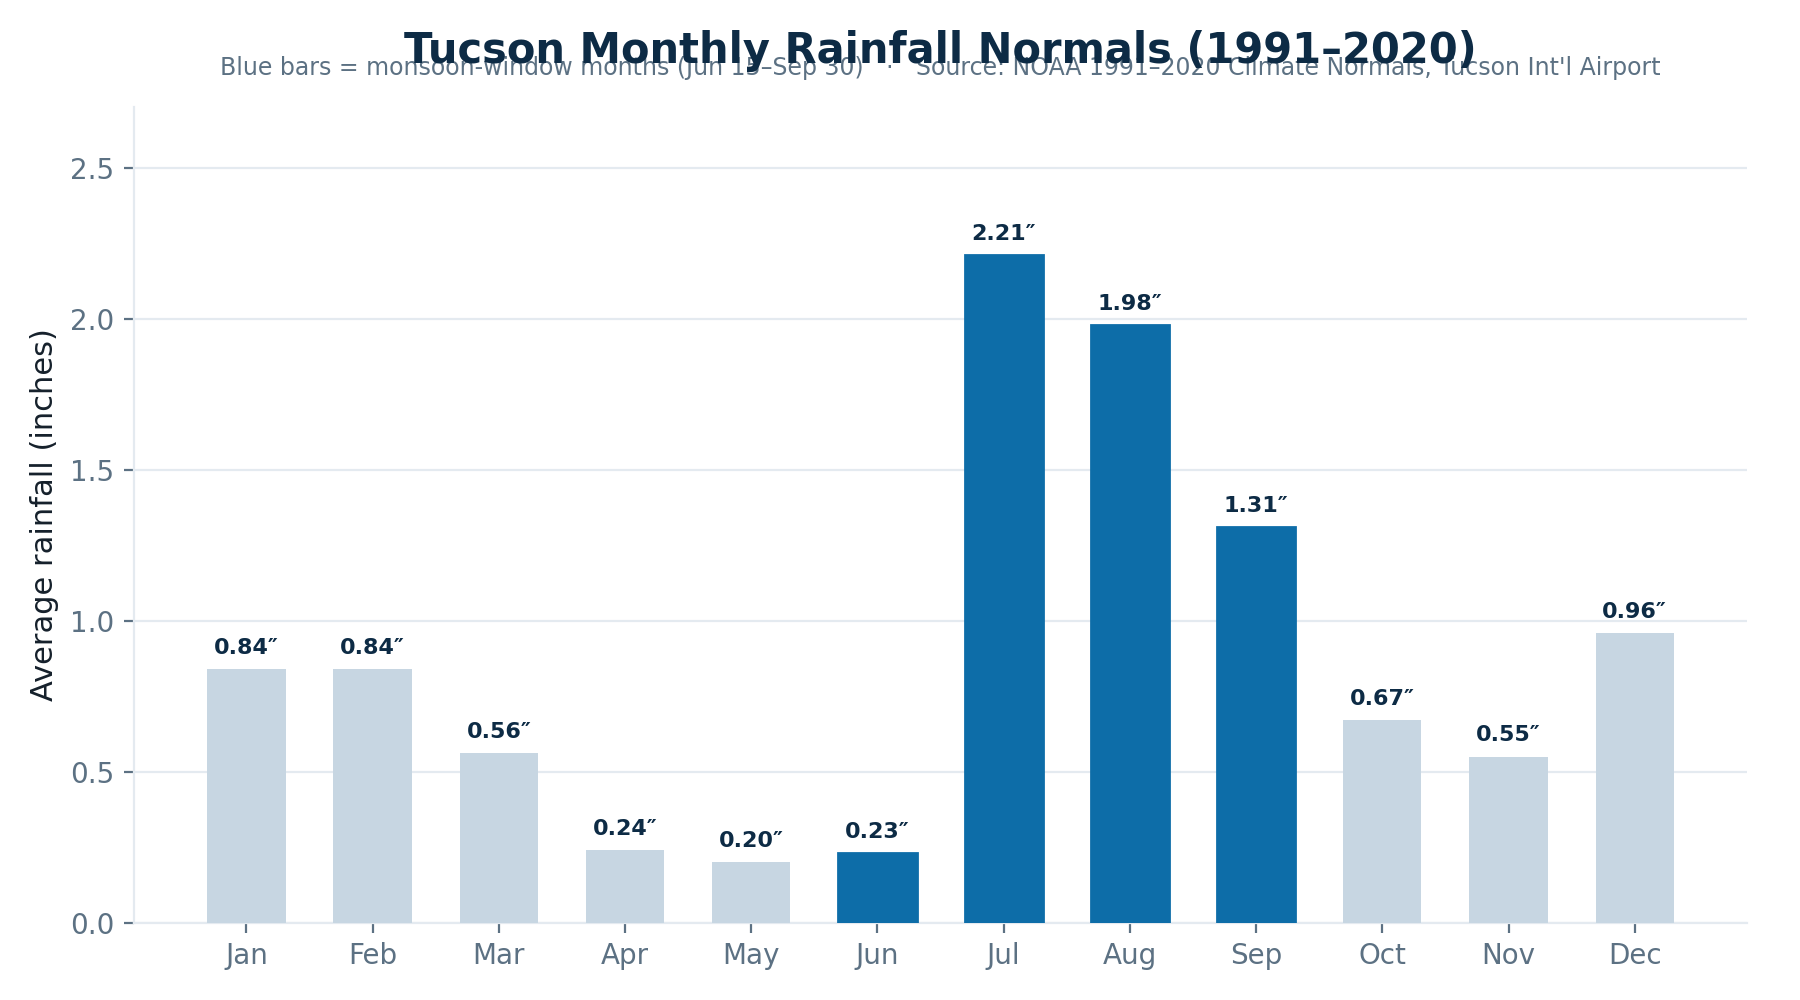
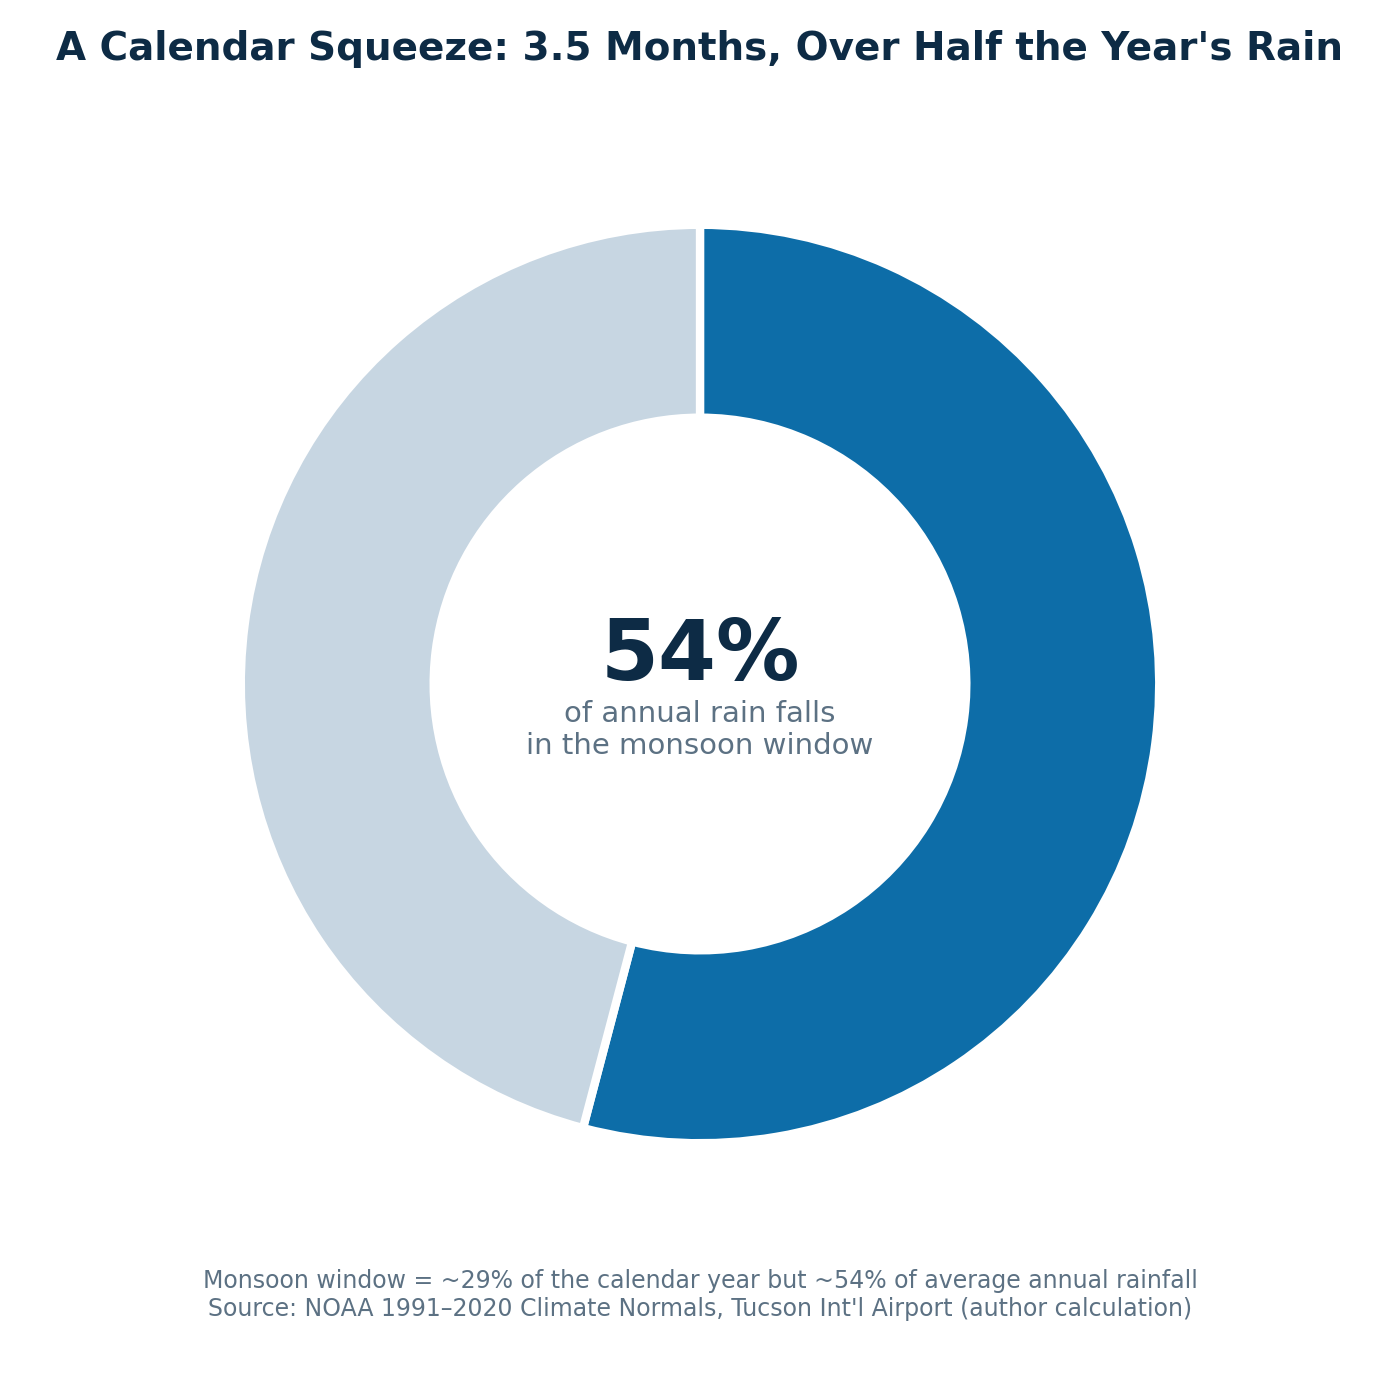
The North American Monsoon compresses most of Tucson’s rain into a short calendar window. NOAA’s 1991–2020 climate normals for Tucson International Airport show July (2.21″) and August (1.98″) as the two wettest months of the year by a wide margin — together roughly 40% of the metro’s average annual precipitation, and combined with June and September, roughly 54% of the year’s rain falls inside the official June 15–September 30 monsoon window.
Put another way: a season that occupies roughly 3.5 of the year’s 12 months (about 29% of the calendar) delivers more than half the year’s rain. That concentration is exactly why flash flooding, roof and wall-line water intrusion, and swamp-cooler and drainage failures cluster so heavily into a few weeks each summer.
Why Does Flash-Flood Risk Spike So Fast in Tucson?
Pima County’s washes are ephemeral — dry most of the year — which is exactly what makes them dangerous during monsoon storms. The Pima County Regional Flood Control District, formed in 1978 after a run of federally declared flood disasters, tracks conditions through its ALERT network of rain and stream sensors and has said publicly that a dry wash can turn into a dangerous flow in as little as 45 minutes once a heavy cell moves over its watershed. The district’s benchmark event is the October 1–2, 1983 flood, when 6.5–7.5 inches of rain fell over five days — still cited by NWS and Pima County as the region’s flood of record. FEMA issued updated flood hazard maps for Pima County in January 2026, reflecting revised floodplain and wash-overflow modeling.
The practical takeaway for homeowners: proximity to a named or unnamed wash matters more than whether an address sits inside a FEMA-mapped 100-year floodplain. Localized wash overflow and sheet flow across low points cause a large share of residential water-intrusion events every monsoon season, including at homes outside any mapped flood zone.
How Fast Does Mold Start After a Monsoon Leak?
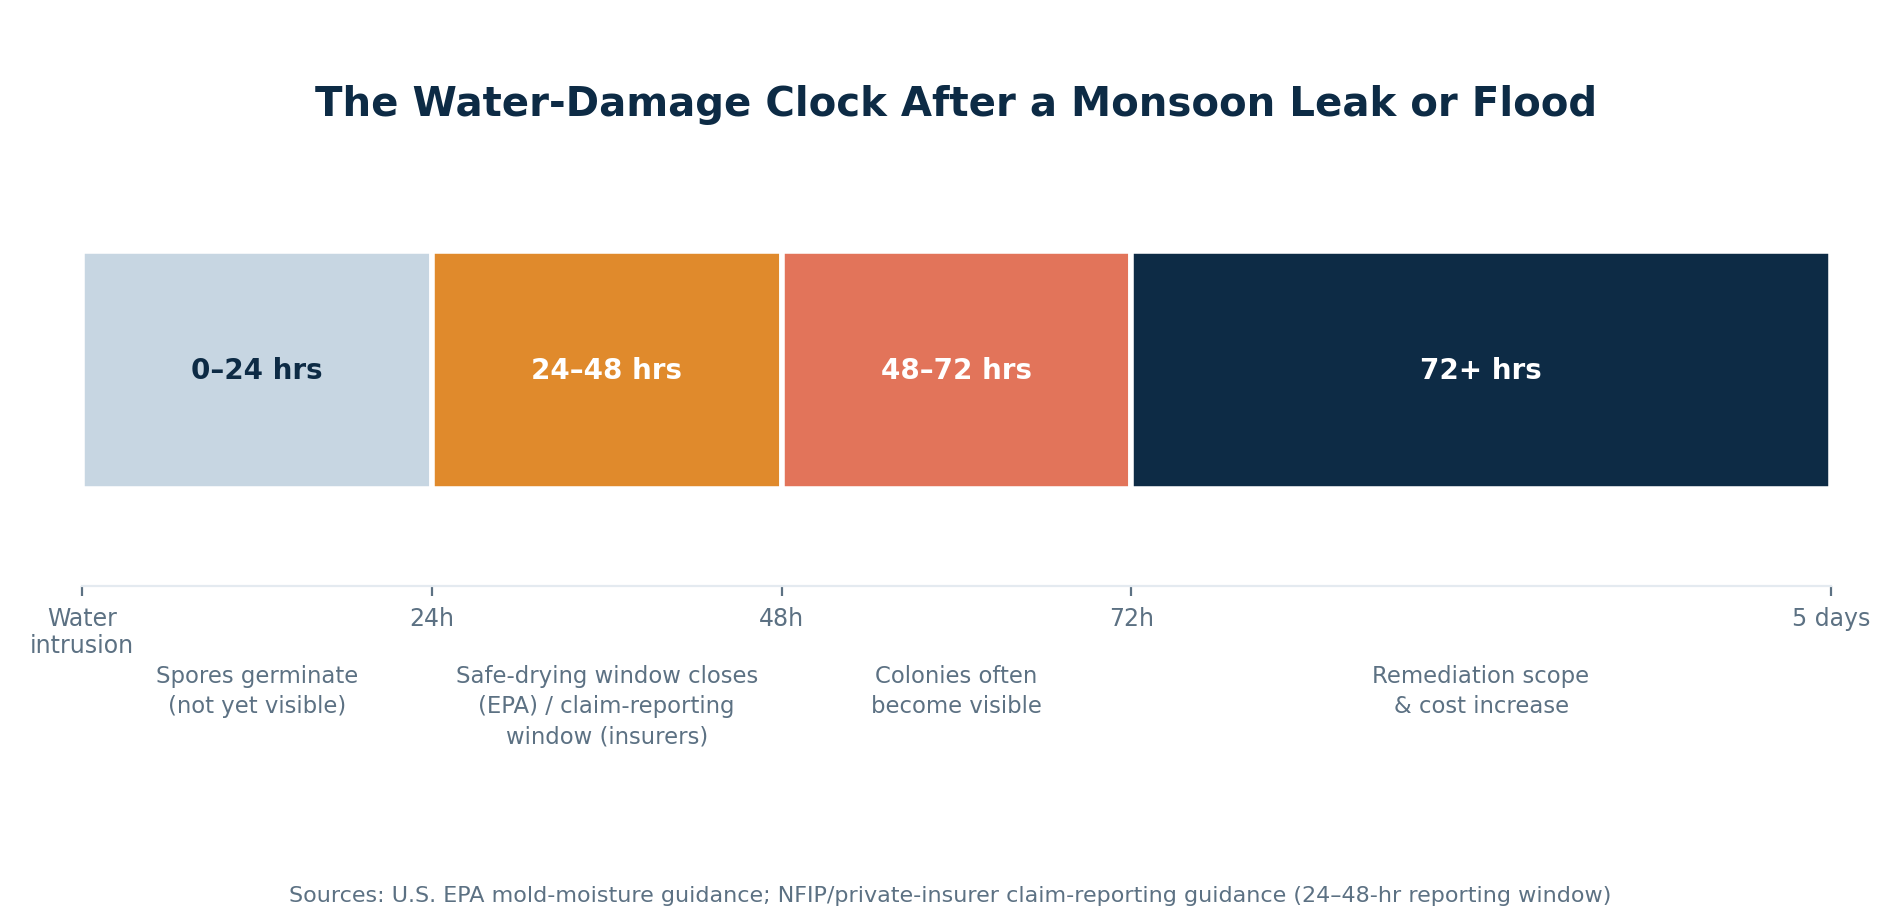
This is the part of storm damage that’s most consistently misunderstood, and it’s also where two very different public data sources — one about biology, one about insurance paperwork — land on almost the exact same number.
| Time since water exposure | What the data says |
|---|---|
| 0–24 hrs | Mold spores already present in most homes begin germinating on wet materials. Nothing is visible yet. |
| 24–48 hrs | Per EPA guidance, this is the outer edge of the safe-drying window — and it’s also the window most NFIP and private flood policies recommend for reporting a claim. The two clocks run in parallel. |
| 48–72 hrs | Colonies that began forming in the prior window can become visible as dark or greenish-black spotting on drywall, framing, or carpet backing. |
| 72+ hrs / weeks | Untreated growth spreads to adjoining wet materials; remediation scope typically increases the longer materials stay wet. |
What This Data Means for Your Home
- The clock starts at the leak, not at the claim. Because the mold-safe-drying window and the insurer-recommended reporting window are both roughly 24–48 hours, documenting damage (photos, moisture readings, a timestamped call) early protects both your health and your claim at the same time.
- “Outside the floodplain” doesn’t mean “no risk.” Pima County’s own flood-control planning points to wash overflow and sheet flow — not just mapped 100-year floodplains — as a major driver of residential water intrusion. Check your address against the current FEMA Flood Map Service Center rather than assuming based on your neighborhood.
- Peak-window timing is predictable, even if individual storms aren’t. Mid-July through mid-August is consistently the highest-frequency stretch for storm activity and flash-flood warnings in Tucson. Homeowners who inspect roof drains, swamp-cooler pans, and grading before that window enter monsoon season with less exposure.
- Your street’s rain total may differ sharply from the official one. In 2026 the airport gauge read about normal while the median Pima County gauge read 8.53″. Check the nearest gauge in the table above (or on xmACIS / CoCoRaHS) rather than relying on the airport figure alone.
If you’re dealing with active water intrusion from this monsoon season, our monsoon flood cleanup page walks through what to check before you call, and our mold remediation page covers the same 24–48-hour timeline in the context of an active leak. Call now on the Tucson Restoration Pros homepage and we’ll connect you with an independent, licensed local provider — free to ask, no obligation. Our page on water damage restoration for businesses covers what to expect.
Get connected to a licensed Tucson restoration pro — tap to call (866) 695-5058
Call (866) 695-5058Tucson Restoration Pros is a free referral service: we connect you with independent local pros in our network for water, mold, and storm damage. We do not perform the work ourselves.
Frequently Asked Questions
How much rain fell during Tucson’s 2026 monsoon, and how did it compare with 2025?
Tucson International Airport, the city’s official gauge, recorded 5.76 inches from June 15 to September 30, 2026 — about 101% of the 1991–2020 normal of 5.69 inches and roughly double the 2.82 inches recorded in 2025 (NOAA ACIS station data, preliminary, retrieved Oct. 13, 2026). Many neighborhood gauges caught more: the median among 53 complete Pima County gauges below 4,500 feet was 8.53 inches.
When does monsoon season officially start and end in Tucson?
The National Weather Service has used fixed calendar dates since 2008: June 15 through September 30. Measurable rain typically arrives somewhat later than June 15, with the highest storm frequency mid-July through mid-August.
What share of Tucson’s yearly rain falls during monsoon season?
Based on NOAA’s 1991–2020 climate normals for Tucson International Airport, roughly 54% of the metro’s average annual rainfall falls between June 15 and September 30 — a window that covers only about 29% of the calendar year.
How fast can a Tucson wash flood during a storm?
The Pima County Regional Flood Control District has said a dry wash can turn into a dangerous flow in as little as 45 minutes once a heavy storm cell moves over its watershed.
How fast does mold grow after a monsoon leak or flood?
Per U.S. EPA guidance, mold can begin germinating within 24 hours of water exposure and often becomes visible within 48–72 hours if materials aren’t fully dried — the same general window most insurers recommend for reporting a flood claim.
Is my home at risk if it isn’t in a FEMA-mapped floodplain?
Potentially, yes. Pima County flood-control planning attributes a large share of residential water-intrusion events to localized wash overflow and sheet flow rather than mapped 100-year floodplains. Check your exact address against the FEMA Flood Map Service Center rather than assuming based on your neighborhood.
How do I cite or embed this report?
See the cite-this-report kit directly below — it’s free to use with attribution.
Cite This Report / Embed Kit
Every figure above is sourced and dated. Journalists, researchers, and local sites are welcome to quote, screenshot, or embed any stat on this page with attribution to Tucson Restoration Pros and a link back to this report. Rainfall figures come from National Weather Service / NOAA station data; please credit them as the underlying source.
Suggested citation
Link snippet (copy-paste HTML)
Embeddable stat card (copy-paste HTML)
Data & Sources
This report is compiled entirely from publicly published data — no original surveys, polling, or proprietary modeling. The 54% monsoon-window rainfall share and the July+August ~40% figure are author calculations performed directly on NOAA’s published 1991–2020 monthly climate normals for Tucson International Airport; the underlying monthly values and full historical flood-event detail are maintained on our companion Tucson Monsoon Season Data & Home Flood-Risk Reference. The 2026 and 2025 season totals, monthly splits, rain-day counts, and gauge comparisons were pulled directly from NOAA’s ACIS station database on Oct 13, 2026; medians and counts are author calculations on that pull (Pima County gauges below 4,500 ft with zero missing days). 2026 values are preliminary and may change slightly after quality control. All other figures are quoted directly from the named source. Compiled and fact-checked August 2026; 2026 season data added October 13, 2026; reviewed each monsoon season (June–September) and updated if a source figure changes.
- NOAA Regional Climate Centers – Applied Climate Information System (ACIS) (2026/2025 daily and seasonal precipitation, Tucson International Airport and Pima County gauges; normals) — data retrieved Oct 13, 2026
- xmACIS – NOAA RCC station data browser (public interface to the same ACIS data) — accessed Oct 13, 2026
- NWS Tucson – Monsoon (official season dates, Monsoon Stats tracker powered by ACIS) — accessed Oct 13, 2026
- NWS Tucson – Monthly Normals & Extremes — accessed Oct 13, 2026
- NOAA NCEI – U.S. Climate Normals (1991–2020) — accessed Oct 13, 2026
- CoCoRaHS – Community Collaborative Rain, Hail & Snow Network (volunteer gauge network) — accessed Oct 13, 2026
- Pima County Regional Flood Control District — accessed Oct 13, 2026
- Pima County – Historical Flood Events — accessed Oct 13, 2026
- FEMA – Updated Flood Maps for Pima County (Jan. 2026) — accessed Aug 2026
- U.S. EPA – A Brief Guide to Mold, Moisture, and Your Home — accessed Oct 13, 2026
- FEMA – How Do I Start My Flood Claim? — accessed Aug 2026
- Arizona Daily Star – “Tucson’s 2026 monsoon season arrives on schedule,” June 15, 2026 — accessed Oct 13, 2026
Related Tucson Resources
Tucson Monsoon Season Data & Home Flood-Risk Reference · Monsoon Flood Cleanup in Tucson, AZ · Mold Remediation in Tucson, AZ · Does Insurance Cover Monsoon Flood Damage in Arizona? · How We Research & Source Our Guidance
Disclosure: Tucson Restoration Pros (tucsonrestorationpros.com) is a lead-generation and referral service. We are not a restoration contractor, are not affiliated with any government agency, and do not perform restoration, mitigation, or repair work. When you submit your information, we connect you with one or more independent, qualified local restoration companies that handle the work, licensing, and insurance. We make no guarantee about any specific company’s results. In a life-threatening emergency, call 911. Same-day, emergency, and 24/7 availability are not guaranteed and depend on provider schedules, location, and demand. Calls and form submissions placed through this site may be connected with a participating provider, and you may be contacted by that provider regarding your request. Service availability, pricing, licensing, and final response times are determined solely by the providers.
Need help now? Dealing with this in your home right now? See flood damage restoration, water damage restoration in Tucson or 24/7 emergency water removal — free 24/7 dispatch to a licensed local company, or call (866) 695-5058.